GHG emissions results

We aim to reduce our greenhouse gas emissions (Scope 1 and 2 GHG emissions by 50% and Scope 3 by 30% by 2030 (compared to 2015)) across the entire supply chain by 2030 at the same time as achieving business growth.
By visualizing our GHG emissions, we hope to share information with our many stakeholders about the overall state of GHG emissions, potential countermeasures, and other topics in the hope that this will lead to further emissions reduction.
http://www.env.go.jp/earth/ondanka/supply_chain/gvc/en/files/supply_chain_en.pdf
★: Covered by third-party assurance (Third-party assurance report)
* The calculation method before 2023 is based on the method used at that time.
* Coca-Cola Bottlers Japan Holdings Inc. and other consolidated subsidiaries such as Coca-Cola Bottlers Japan Inc. are included in this category.
* The “Emissions Factors by Electric Power Company” published by the Ministry of the Environment and the Ministry of Economy, Trade and Industry are based on the following data: January-March 2025: FY2023 results (published in March 2025); April-December 2025: FY2024 results (published in February 2026).
| Scope | Emissions (t-CO2e) | 2025 Accounting method | ||||||
|---|---|---|---|---|---|---|---|---|
| CCBJH Group |
Activity data | Emission factor | ||||||
| 2023 | 2024 | 2025 | ||||||
| Scope 1 | Direct greenhouse gas emissions by the reporting company |
192,795 | 186,383 | 184,862 ★ | Amount of fuel used in offices, sales centers, plants, distributions, etc., and the amount of Fluorocarbons leakage. |
Emission factor from the Greenhouse Gas Emissions Accounting and Reporting Manual (Ver.6.1) (Ministry of the Environment and Ministry of Economy, Trade and Industry; March 2026) ,Emission factors for piped gas are taken from “Emission Factors by Gas Utility (for Calculation of Greenhouse Gas Emissions by Specified Emitters) - Supply Results for FY2024” (June, 2025).,and GWP file for 2026 report of Fluorocarbon Emissions Control Act | ||
| Scope 2 Location-based |
Indirect emissions from the use of electricity, heat, or steam supplied by others |
172,571 | 167,849 | 166,293 ★ | Amount of electricity used in offices, sales centers, plants, etc. |
Based on Emission factor by Electricity Provider (Greenhouse Gas Emissions Accounting for Specified Organizations) Using region-specific emission factors (national average factors) | ||
| Scope 2 Market-based |
170,936 | 168,568 | 144,718 ★ | Based on Emission factor by Electricity Provider (Greenhouse Gas Emissions Accounting for Specified Organizations)Adjusted emission factors by utility company plan are used for manufacturing and office areas. | ||||
| Scope 1, 2 total amount (Scope 2 Market-based) |
363,731 | 354,951 | 329,581 ★ | |||||
| Scope | Category | Emissions (t-CO2e) | 2025 Accounting method | |||||
| CCBJH Group |
Activity data | Emission factor | ||||||
| 2023 | 2024 | 2025 | ||||||
| Scope 3 | 1 | Purchased goods and services |
1,312,262 | 1,249,410 | 1,233,379 | Procured raw materials (based on weight) |
The Coca-Cola Company's emission factor | |
| 2 | Fixed assets | 105,045 | 132,297 | 124,894 | Fiscal year increase in amount of fixed assets (net price) |
Emission factor according to price of fixed assets from the Ministry of the Environment's emission factor database (Ver.3.6) for use with the Basic Guidelines on Accounting for Greenhouse Gas Emissions throughout the Supply Chain | ||
| 3 | Fuel- and energy related activities not included in Scope 1 or Scope 2 |
67,628 | 68,149 | 67,561 | Amount of fuel, electricity, heat used |
Emission factor for fuel procurement from the Ministry of the Environment's emission factor database (Ver.3.6) for use with the Basic Guidelines on Accounting for Greenhouse Gas Emissions throughout the Supply Chain | ||
| 4 | Transport and delivery (upstream) |
89,011 | 89,954 | 83,244★ | Amount of fuel used for outsourced transportation |
Emission factor from the Greenhouse Gas Emissions Accounting and Reporting Manual (Ver.6.1) (Ministry of the Environment and Ministry of Economy, Trade and Industry; March 2026) | ||
| 5 | Waste generated in operations |
20,764 | 18,742 | 17,875 | Waste by weight or disposal fee |
Emission factor for industrial waste based on an industry input-output model from the Ministry of the Environment's emission factor database (Ver.3.6) for use with the Basic Guidelines on Accounting for Greenhouse Gas Emissions throughout the Supply Chain | ||
| 6 | Business travel | 4,528 | 4,609 | 4,837 | Employee transportation expenses paid |
Emission factor for transportation expenses from the Ministry of the Environment's emission factor database (Ver.3.6) for use with the Basic Guidelines on Accounting for Greenhouse Gas Emissions throughout the Supply Chain | ||
| 7 | Employee commuting |
3,618 | 3,440 | 2,918 | Employee commuter expenses paid |
Emission factor for transportation expenses from the Ministry of the Environment's emission factor database (Ver.3.6) for use with the Basic Guidelines on Accounting for Greenhouse Gas Emissions throughout the Supply Chain | ||
| 8 | Leased assets (upstream) |
N/A | N/A | N/A | N/A | N/A | ||
| 9 | Transportation and delivery (downstream) |
N/A | N/A | N/A | N/A | N/A | ||
| 10 | Processing of sold products |
N/A | N/A | N/A | N/A | N/A | ||
| 11 | Use of sold products | N/A | N/A | N/A | N/A | N/A | ||
| 12 | End-of-life treatment of sold products |
12,241 | 12,810 | 14,627 | Recycling of containers and packaging recycled applied for in accordance with the Recycling of Containers and Packaging Act |
Emission factor for waste by treatment method from the Ministry of the Environment's emission factor database (Ver.3.6) for use with the Basic Guidelines on Accounting for Greenhouse Gas Emissions throughout the Supply Chain | ||
| 13 | Leased assets (downstream) |
372,295 | 333,076 | 313,553 ★ | Electricity use of sales equipment (vending machines, coolers, dispensers) |
Calculated by multiplying the annual electricity consumption per vending machine by the number of machines in operation during the current fiscal year. Emission factors are generally based on region-specific emission factors (national average factors); however, site-specific emission factors are used for vending machines utilizing non-fossil fuel certificates. Note that there are 1,295 vending machines utilizing non-fossil fuel certificates. The emissions equivalent to 1,135,000 kWh of annual electricity consumption, when multiplied by the region-specific emission factor (national average factor), amount to 480 t-CO₂e. |
||
| 14 | Franchises | N/A | N/A | N/A | N/A | N/A | ||
| 15 | Investments | N/A | N/A | N/A | N/A | N/A | ||
| Scope 3 total amount | 1,987,392 | 1,912,486 | 1,862,888 | |||||
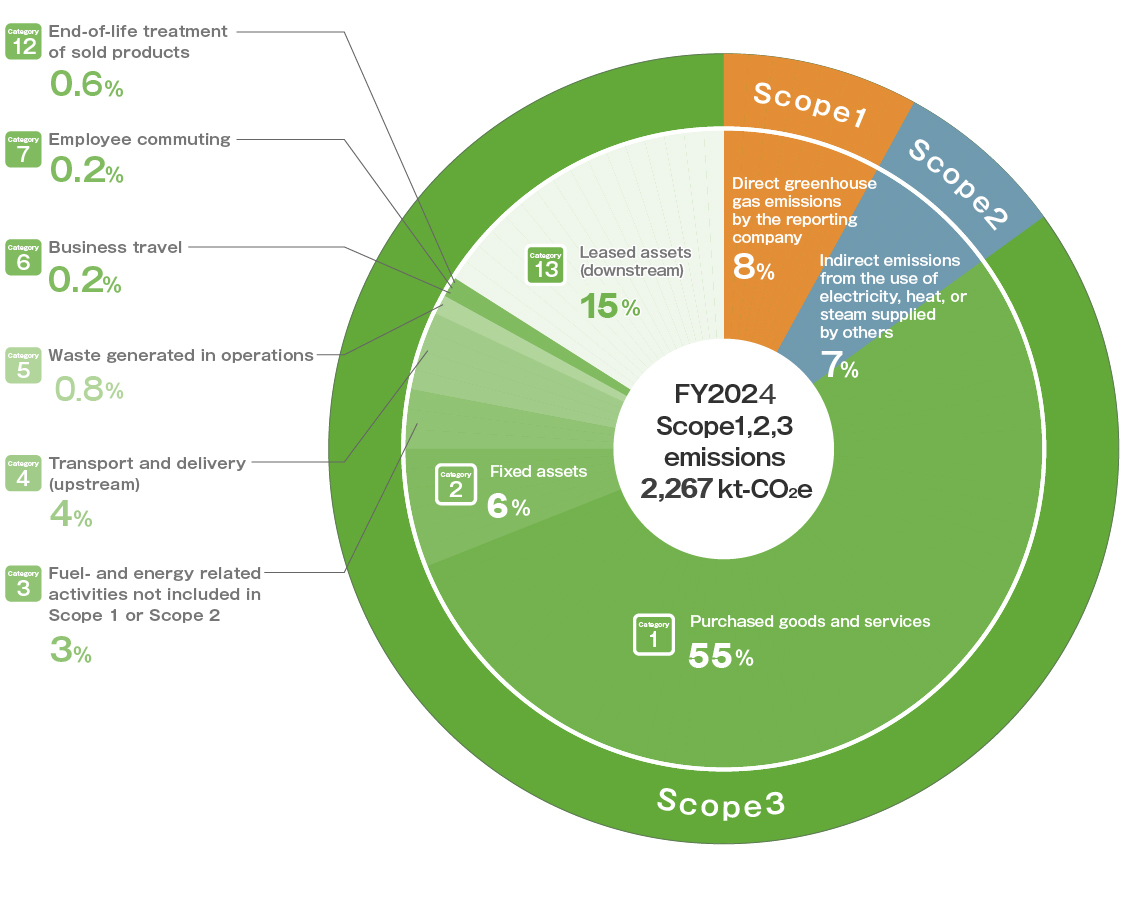
Percentage of GHG emissions Scope 1,2,3 of Coca-Cola Bottlers Japan Holdings Inc. in 2025